




Perimenopause is rarely just one symptom. It’s the night sweat at 3am, the brain fog at your 10am meeting, the aching joints on the stairs and the mood dip that comes out of nowhere. On their own, each one might seem manageable. Together, they can feel like a lot.
That’s exactly why we built Symptom Burden: one score that brings your whole symptom picture together, so you can finally see it the way you feel it.
What is Symptom Burden?
Symptom Burden is a single score out of 100 that shows how your symptoms, all of them, compare with women across the Peri community.
It looks back over your last 30 days and answers a question many women ask themselves quietly: is what I’m going through a lot? Now you don’t have to guess. You can see where you sit, which symptoms are driving it, and how it’s changing over time.
Think of it as your full symptom profile on one screen. Not a diagnosis, not a judgement, just a clear, honest picture of your experience, backed by data.
How your score is worked out
Your score combines two sources: what your Peri wearable measures, and what you tell us.
Peri Algorithm symptoms. Hot flushes, night sweats, sleep disruption and anxiety are tracked automatically by your Peri device. You’ll spot the ◈ Peri Algorithm label next to these in the app.
Your logged symptoms. Everything else, from brain fog to joint pain to vaginal dryness, comes from the symptoms you log in the app.
We then group everything into seven symptom areas:
| Symptom area | What’s included |
|---|---|
| Vasomotor | Hot flushes and night sweats (Peri Algorithm), plus cold sweats, feeling cold, heart palpitations, dizziness and vertigo |
| Sleep | Sleep disruption (Peri Algorithm), measured as minutes awake per night |
| Psychological | Anxiety (Peri Algorithm), plus mood swings, low mood, feeling tense, irritability, low energy and more |
| Urogenital | Sexual and genital symptoms (low libido, vaginal dryness, painful sex, period changes) and urinary symptoms (needing a wee more often, bladder weakness, UTIs) |
| Somatic | Musculoskeletal (joint and muscle pain), neurological (headaches, migraine, tingling, tinnitus) and digestive (bloating, heartburn, nausea) |
| Cognitive | Brain fog, difficulty concentrating, memory problems, fatigue |
| Self-perception | Skin, hair and nail changes, weight gain, dry eyes, mouth and gum changes |
Why lots of small symptoms still count
Here’s the part we’re proudest of. Your score isn’t just about how intense your worst symptom is. It’s also weighted by how many symptom areas you’re experiencing.
So if your hot flushes are mild, but you’re also dealing with poor sleep, aching joints, low mood and brain fog, your score reflects that. We know that five “low” symptoms at once can be just as draining as one big one, and often more so. Symptom Burden finally gives that experience a number.
Reading your score
Open Symptom Burden and you’ll see your score for the last 30 days at the top, with a breakdown of every symptom category underneath.
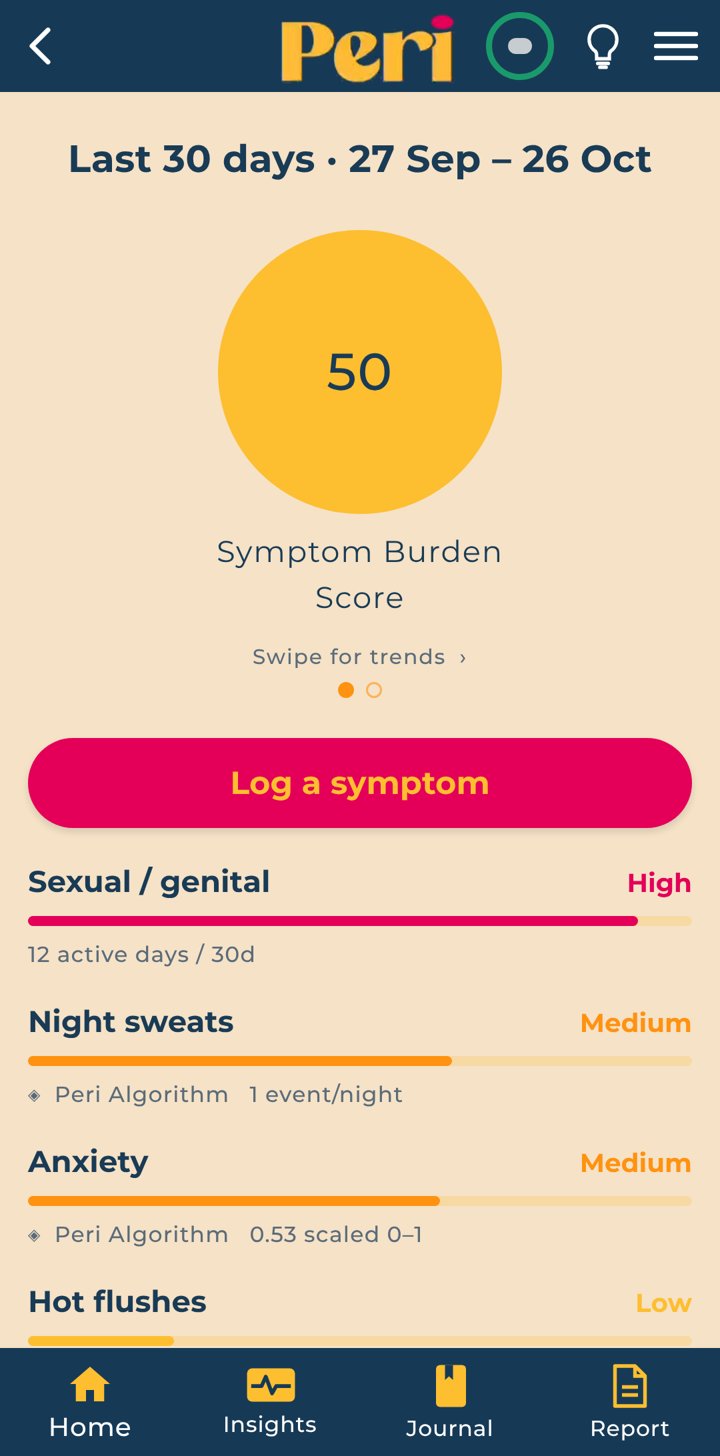
Your score out of 100
The higher the number, the more your symptoms are affecting you compared with the Peri community. It’s not a pass or fail. It’s a starting point for understanding your body.
High, Medium and Low
Each symptom category gets its own label, based on typical symptom levels across the Peri community:
- Low below what most women in the community experience
- Medium around what most women experience
- High more than most women experience
The coloured bar beside each one shows you at a glance where that symptom sits. Categories are ordered with your biggest contributors at the top, so you can see straight away what’s driving your score.
What the numbers under each category mean
Peri Algorithm symptoms show what your device measured, like 1 event/night for night sweats, 0.7 events/day for hot flushes, or 28 min wake/night for sleep disruption.
Logged symptoms show how many days in the last 30 you logged a symptom in that category, like 12 days for sexual and genital symptoms.
An example
One Peri member has a score of 50/100. Her hot flushes and sleep disruption are both Low. On their own, those might suggest things are pretty calm. But her night sweats and anxiety are Medium, and she’s logged sexual and genital symptoms on 12 of the last 30 days, which is High.
That’s the full picture her score captures. Without it, she might have looked at her hot flushes and wondered why she still feels so worn down.
Your trends: how things are changing
Swipe left on your score to open Your trends. This is where you see whether things are easing, holding steady or building up.
Use the Week and Month toggle to switch views:
- Week shows your daily score for the last 7 days, your 7-day average, and how it compares with the previous 7 days.
- Month shows your daily score across the last 30 days, your 30-day average, and a week-by-week breakdown (Wk 1, Wk 2, Wk 3, This wk) so you can spot where a change began.
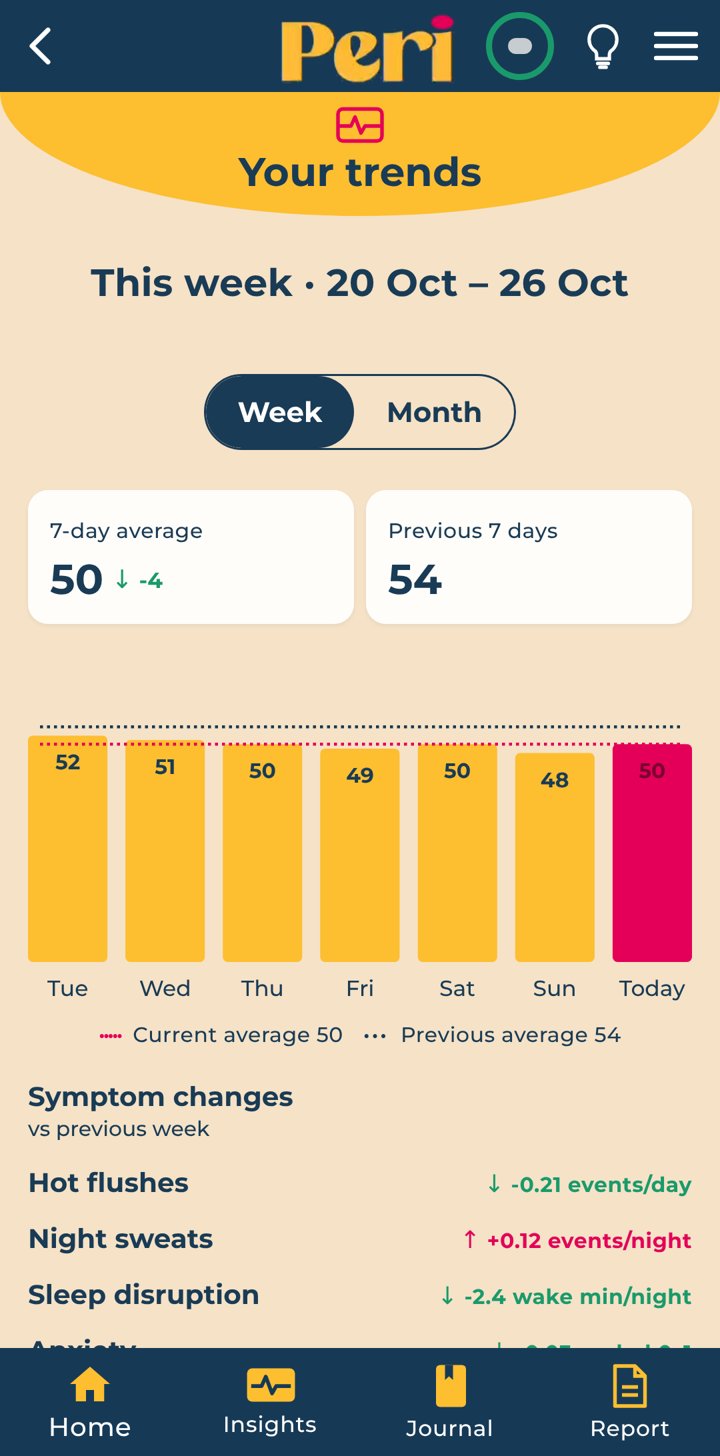
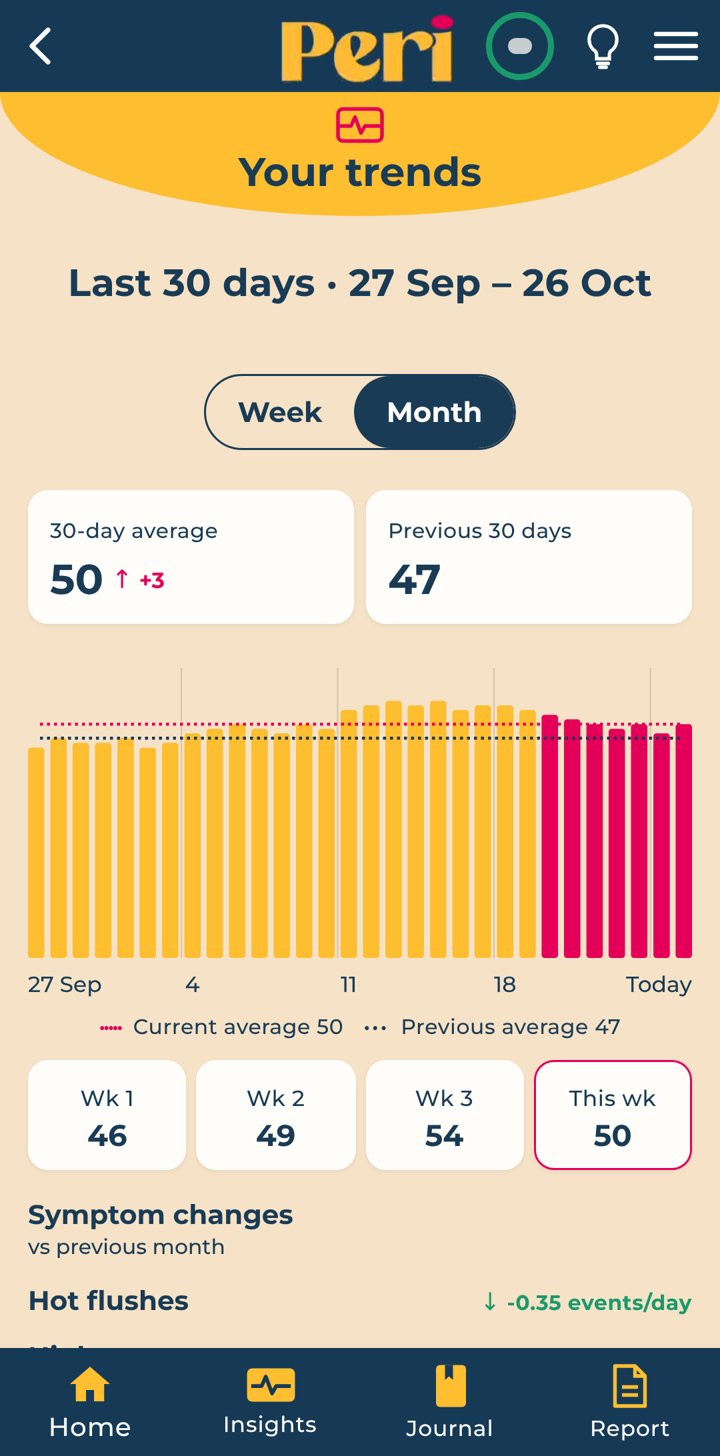
Two dotted lines on the chart show your current average and your previous average, so you can see at a glance if you’re trending up or down.
Symptom changes
Under the chart, every symptom category is compared with the previous week or month:
- Green arrow down: that symptom has eased, for example −2.4 wake min/night for sleep disruption
- Pink arrow up: that symptom has increased, for example +0.12 events/night for night sweats
- No change: things are holding steady
- Comparison not available: there isn’t enough data from the previous period to compare yet
This is where patterns start to jump out. Maybe your sleep improved the same week your anxiety eased. Maybe your night sweats picked up after a stressful fortnight. Your trends help you connect the dots.
Making Symptom Burden work for you
- Wear Peri consistently. The more your device sees, the more accurately it can track your hot flushes, night sweats, sleep and anxiety.
- Log the small stuff. That niggly headache or bloated afternoon counts. Logging regularly means your score reflects your whole experience, not just the headline symptoms.
- Check your trends, not just today. One high day doesn’t define your month. Look at the weekly and monthly view to see the real direction of travel.
- Spot what’s driving your score. The categories at the top of your breakdown are the ones having the biggest impact right now.
- Notice what helps. Tried a new routine, treatment or bedtime? Watch how your trends respond over the following weeks.
Your questions, answered
Is a high score bad?
No. A higher score simply means your symptoms are having a bigger impact than most women in the community right now. It’s information, not a verdict, and it can help you decide what support you want.
Why does a category say Low when I’ve had that symptom?
Low doesn’t mean zero. It means that symptom is below typical levels across the Peri community.
Why does it say “Comparison not available”?
We need data from the previous week or month to compare against. Keep wearing Peri and logging, and those comparisons will fill in.
Who is the “Peri community”?
Women using Peri, just like you. Your score compares your symptoms with theirs, so you can see your experience in context.
Can Symptom Burden diagnose anything?
No. It’s a tool to help you understand your symptoms and talk about them with confidence. Decisions about your health are yours to make, with whoever you choose to support you.
Your whole story, in one score
Perimenopause has always been more than hot flushes. Now your data shows it too. Open the Peri app, swipe through your Symptom Burden, and see your full symptom profile for the first time.
My body. My data. My rules. My Peri.


